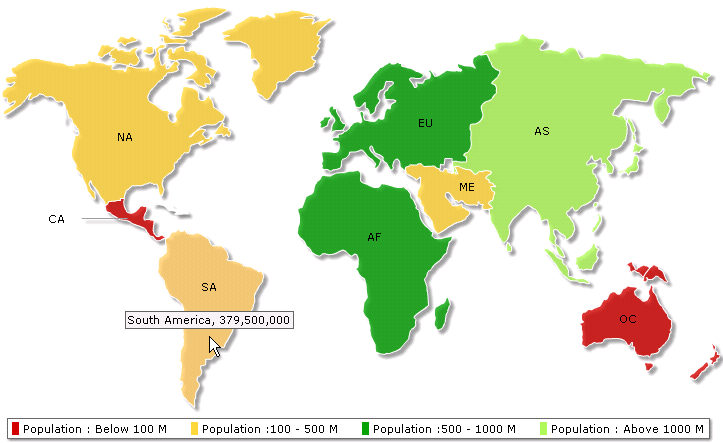
In this section we will see how to render a map using Data URL method - where the XML data is created in a file other than what we use to generate the map. The page that contains the code to render the map is referred to as Map Container Page and the other one which creates the XML data is called Data Provider Page.
Let's look at the codes used in Map Container Page and Data Provider Page one by one.
Map Container Page contains the following code. You can view this code in BasicMapsURL.php file.
<HTML>
<HEAD>
<TITLE>FusionMaps XT XML Data Show</TITLE>
<?php
/*
We've included ../Includes/FusionCharts.js, which contains functions
to help us easily embed the Maps.
*/
include("../Includes/FusionCharts.php");
# We've included FusionCharts.js, which helps in
# easy map rendering.
?>
<script language="javascript" src="../../Maps/FusionCharts.js"></script>
</HEAD>
<BODY>
<?php
# We define a $Data URL that contains the name of the Data Provider Page.(getURLdata.php)
$DataURL ="getURLdata.php";
# Finally Rendering the World8 Maps with renderChart() php function present in FusionCharts.php (which we have already included)
# Since we're using Data URL method, we provide a "" value for Data String here
print renderChart("../../Maps/FCMap_World8.swf",$DataURL,"","UsaMaps", 750, 460,0,0);
?>
</BODY>
</HTML>
- We included two files FusionCharts.php and FusionCharts.js which help to embed the map easily.
- Then we declared a variable, $DataURL that contains the name of the Data Provider Page.
- We passed $DataURL to renderChart() function which retrieves the XML and renders the map.
Here is the code used in the Data Provider Page, which is getURLdata.php in this example.
<?php
/*
Declare array to store world population
we used world map with 8 entities/continents
this 2 dimensional array will store 8 rows of data for each continent of the map
first column of each row will store the Internal Id of each entity on the map
second column will store population data of each entity
*/
# Store population data
# Declare array entity
# array data assign
# Internal ID of Asia # Asia's population
$dataArray[0][1]="01"; $dataArray[0][2]="3779000000";
$dataArray[1][1]="02"; $dataArray[1][2]="727000000";
$dataArray[2][1]="03"; $dataArray[2][2]="877500000";
$dataArray[3][1]="04"; $dataArray[3][2]="421500000";
$dataArray[4][1]="05"; $dataArray[4][2]="379500000";
$dataArray[5][1]="06"; $dataArray[5][2]="80200000";
$dataArray[6][1]="07"; $dataArray[6][2]="32000000";
$dataArray[7][1]="08"; $dataArray[7][2]="179000000";
$strXML="";
# Opening MAP element
$strXML = "<map showLabels='1' includeNameInLabels='1' borderColor='FFFFFF' fillAlpha='80' showBevel='0' legendPosition='Bottom' >";
# Setting Color ranges : 4 color ranges for population ranges
$strXML .= "<colorRange>";
$strXML .= "<color minValue='1' maxValue='100000000' displayValue='Population : Below 100 M' color='CC0001' />";
$strXML .= "<color minValue='100000000' maxValue='500000000' displayValue='Population :100 - 500 M' color='FFD33A' />";
$strXML .= "<color minValue='500000000' maxValue='1000000000' displayValue='Population :500 - 1000 M' color='069F06' />";
$strXML .= "<color minValue='1000000000' maxValue='5000000000' displayValue='Population : Above 1000 M' color='ABF456' />";
$strXML .= "</colorRange><data>";
# Opening data element that will store map data
# Using Data from array for each entity
for($i=0;$i<=7;$i++){
$strXML .= "<entity id='" . $dataArray[$i][1] . "' value='" . $dataArray[$i][2] . "' />";
}
# closing data element
$strXML .= "</data>";
# closing map element
$strXML .= "</map>";
print $strXML;
?>
(Here we have used the same code for XML creation that we used in the Data String example.)
- We declared a 2-dimensional array, dataArray, to store the population data and Internal IDs for 8 continents.
- Then we stored data in the array, the first column was used to store Internal IDs and the second column stored the population value of respective continents.
- Then we declared a variable strXML to store the XML of this map.
- After declaring the variable we set 4 color range to the strXML.
- Then we stored the data from the dataArray to strXML by iterating through dataArray.
- Finally, we sent this data to output stream without any HTML tags.
Here is the snapshot of the final map:
